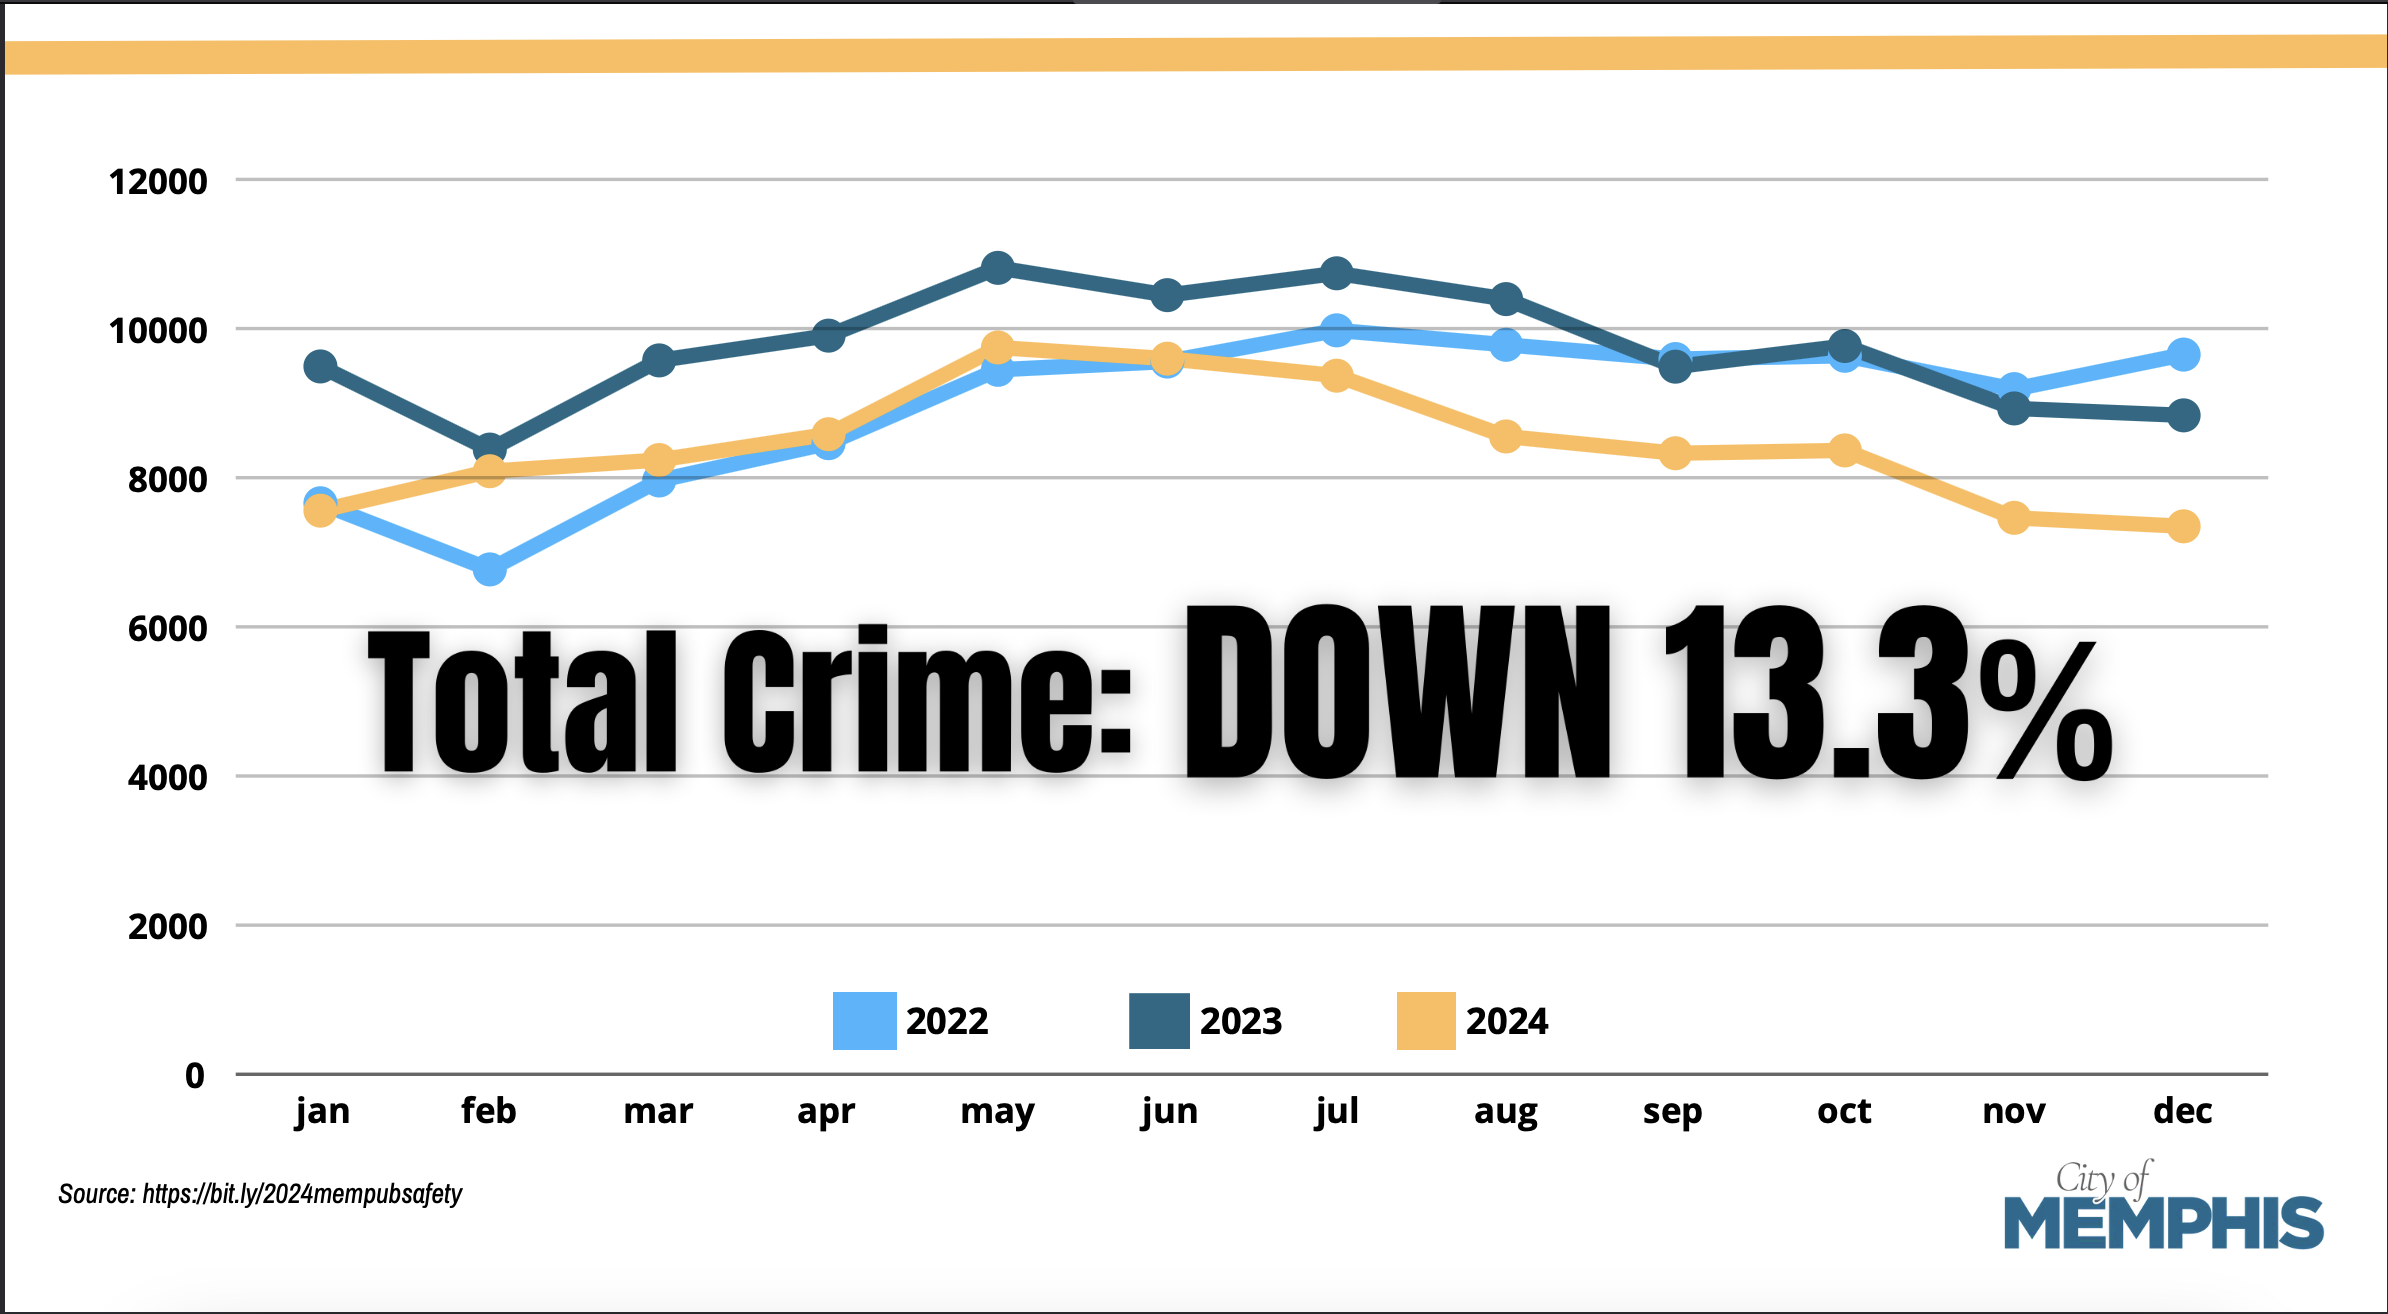
If you’ve been paying attention to news at all, you’ll know crime is down in Memphis.
Yes, it’s a national trend. But, like, who cares. Falling crime in Memphis is good news no matter where it comes from.
Total crime across the city fell 13.3 percent from 2023 to 2024, according to data released from the city at year’s end. Crime was down in every ZIP code in the city, except for 38131 and 38152.
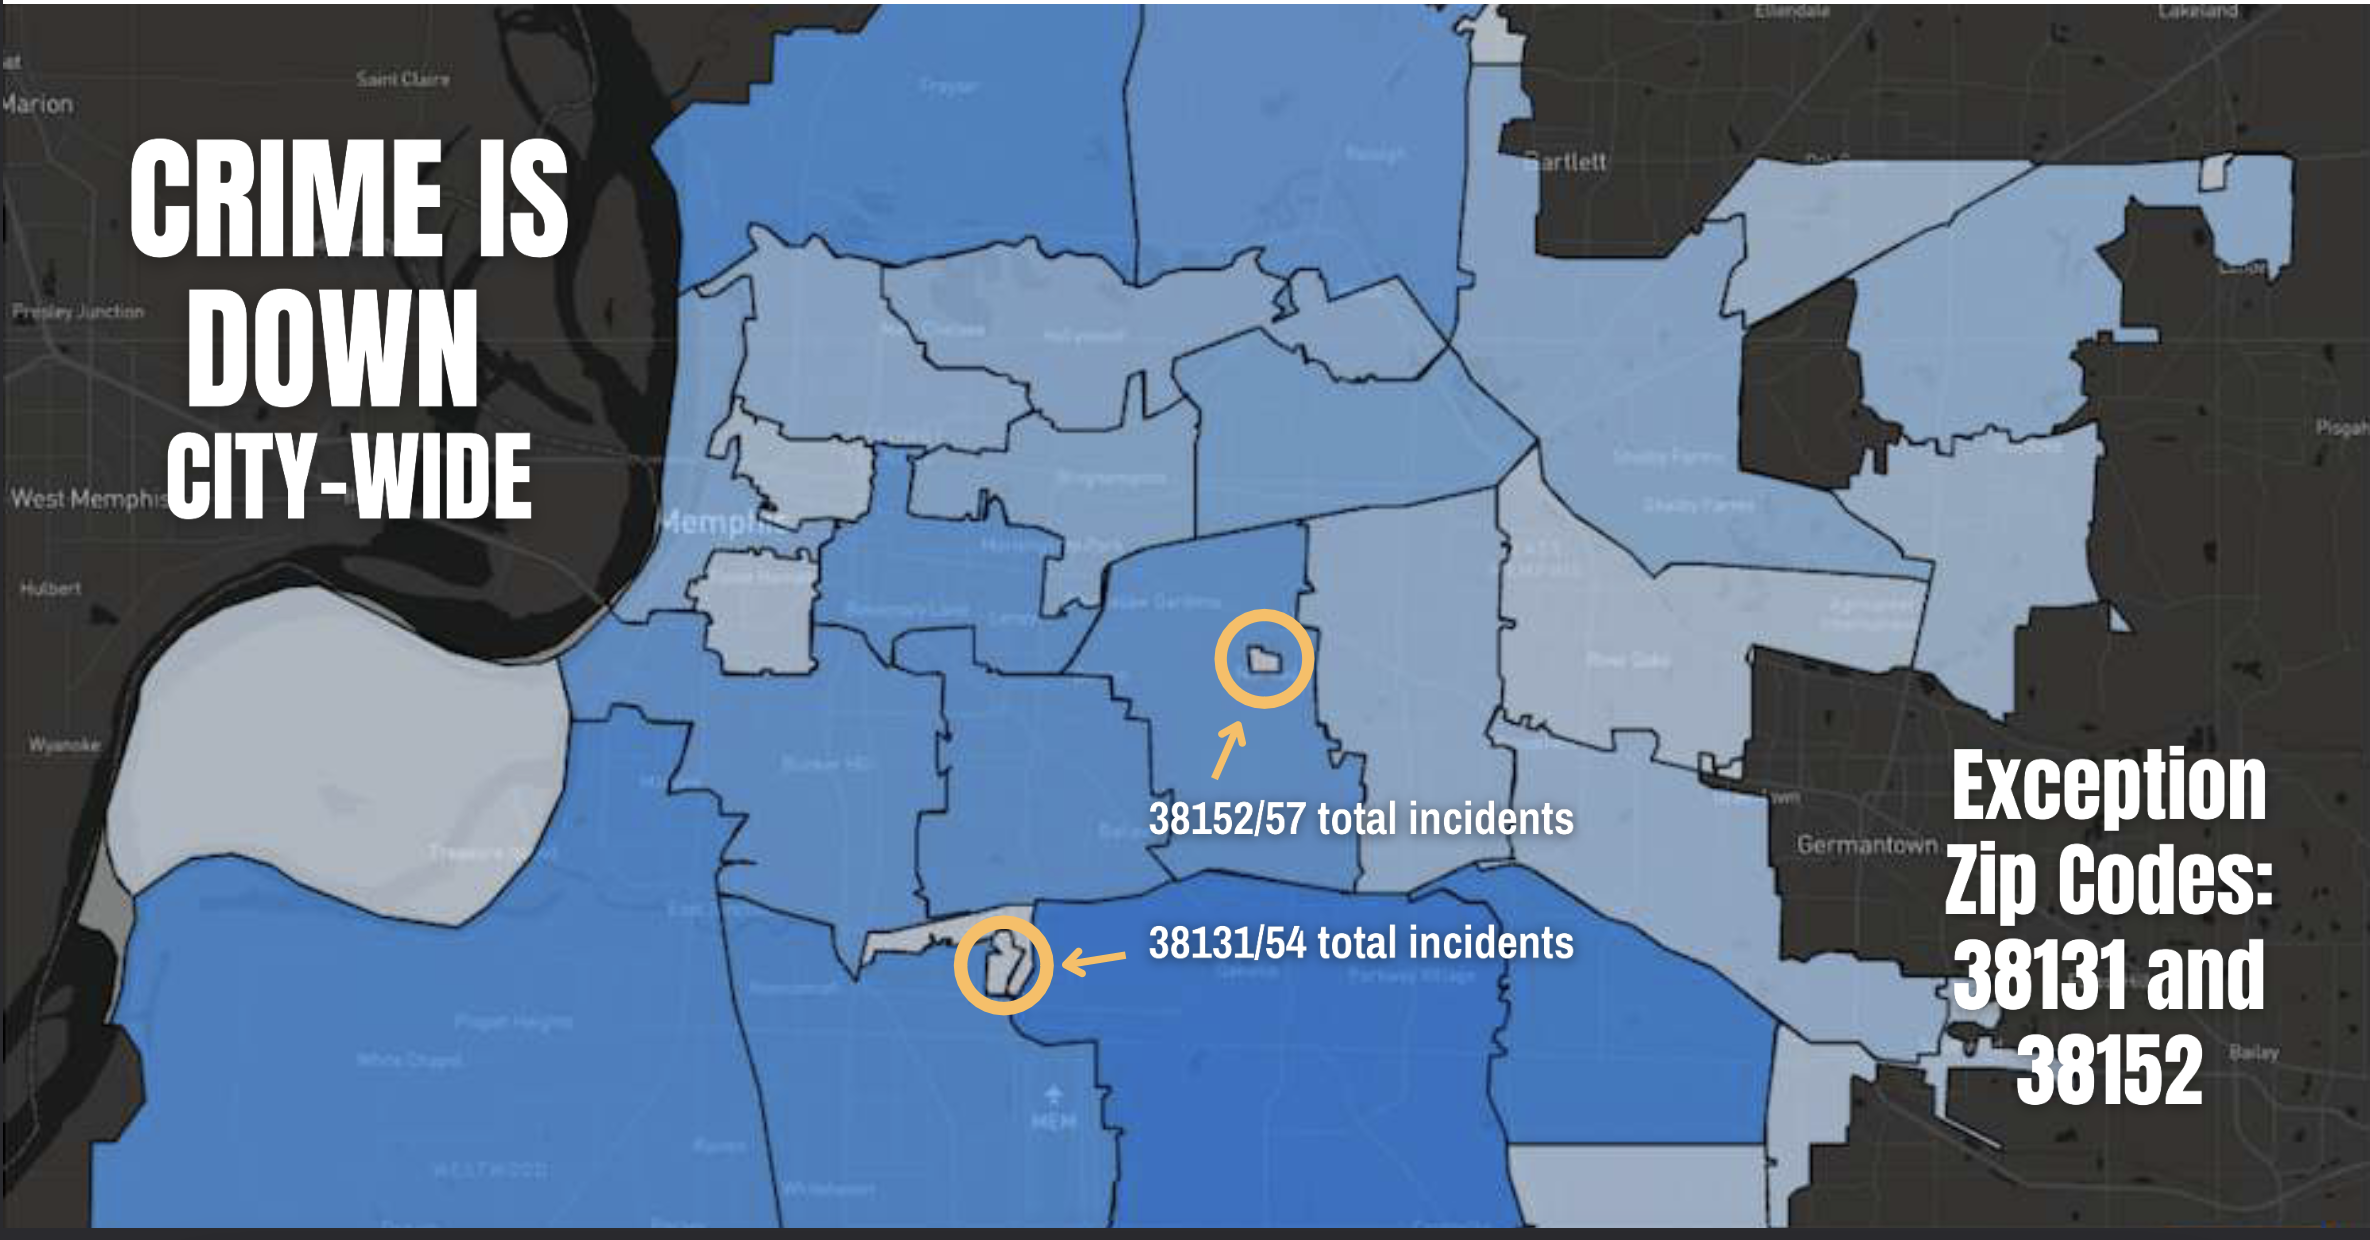
Those two are head-scratchers. (We’re not data experts, so we’re not equipped to label them “aberrations” or whatever.) But 38131 is a neighborhood wedged between Memphis International Airport to the south and I-240 to the north. Last year saw 54 crimes there, and that’s up 42 percent from 2023.
The other area — 38152 — is on the eastern part of University of Memphis campus, encompassing Ball Hall, Campus Elementary School, and big parking lots. Across a big ditch there, nice homes stand in the same ZIP code along Grandview. Last year saw 57 crimes there, and that’s up 83.9 percent from 2023.
The city did not give any details on the crimes in these areas, aberrations or no. In his weekly newsletter Friday, Memphis Mayor Paul Young said, “We are working on it!”
In addition to that year-end report, you can track Memphis crime now with two (new to us) crime stats dashboards.
The first shows Memphis crime year to year. The Crime Analytics dashboard shows unfiltered stats on 40 different types of crimes (from credit card fraud to murder) in three major crime categories — property crimes, personal crimes, and crimes against society.
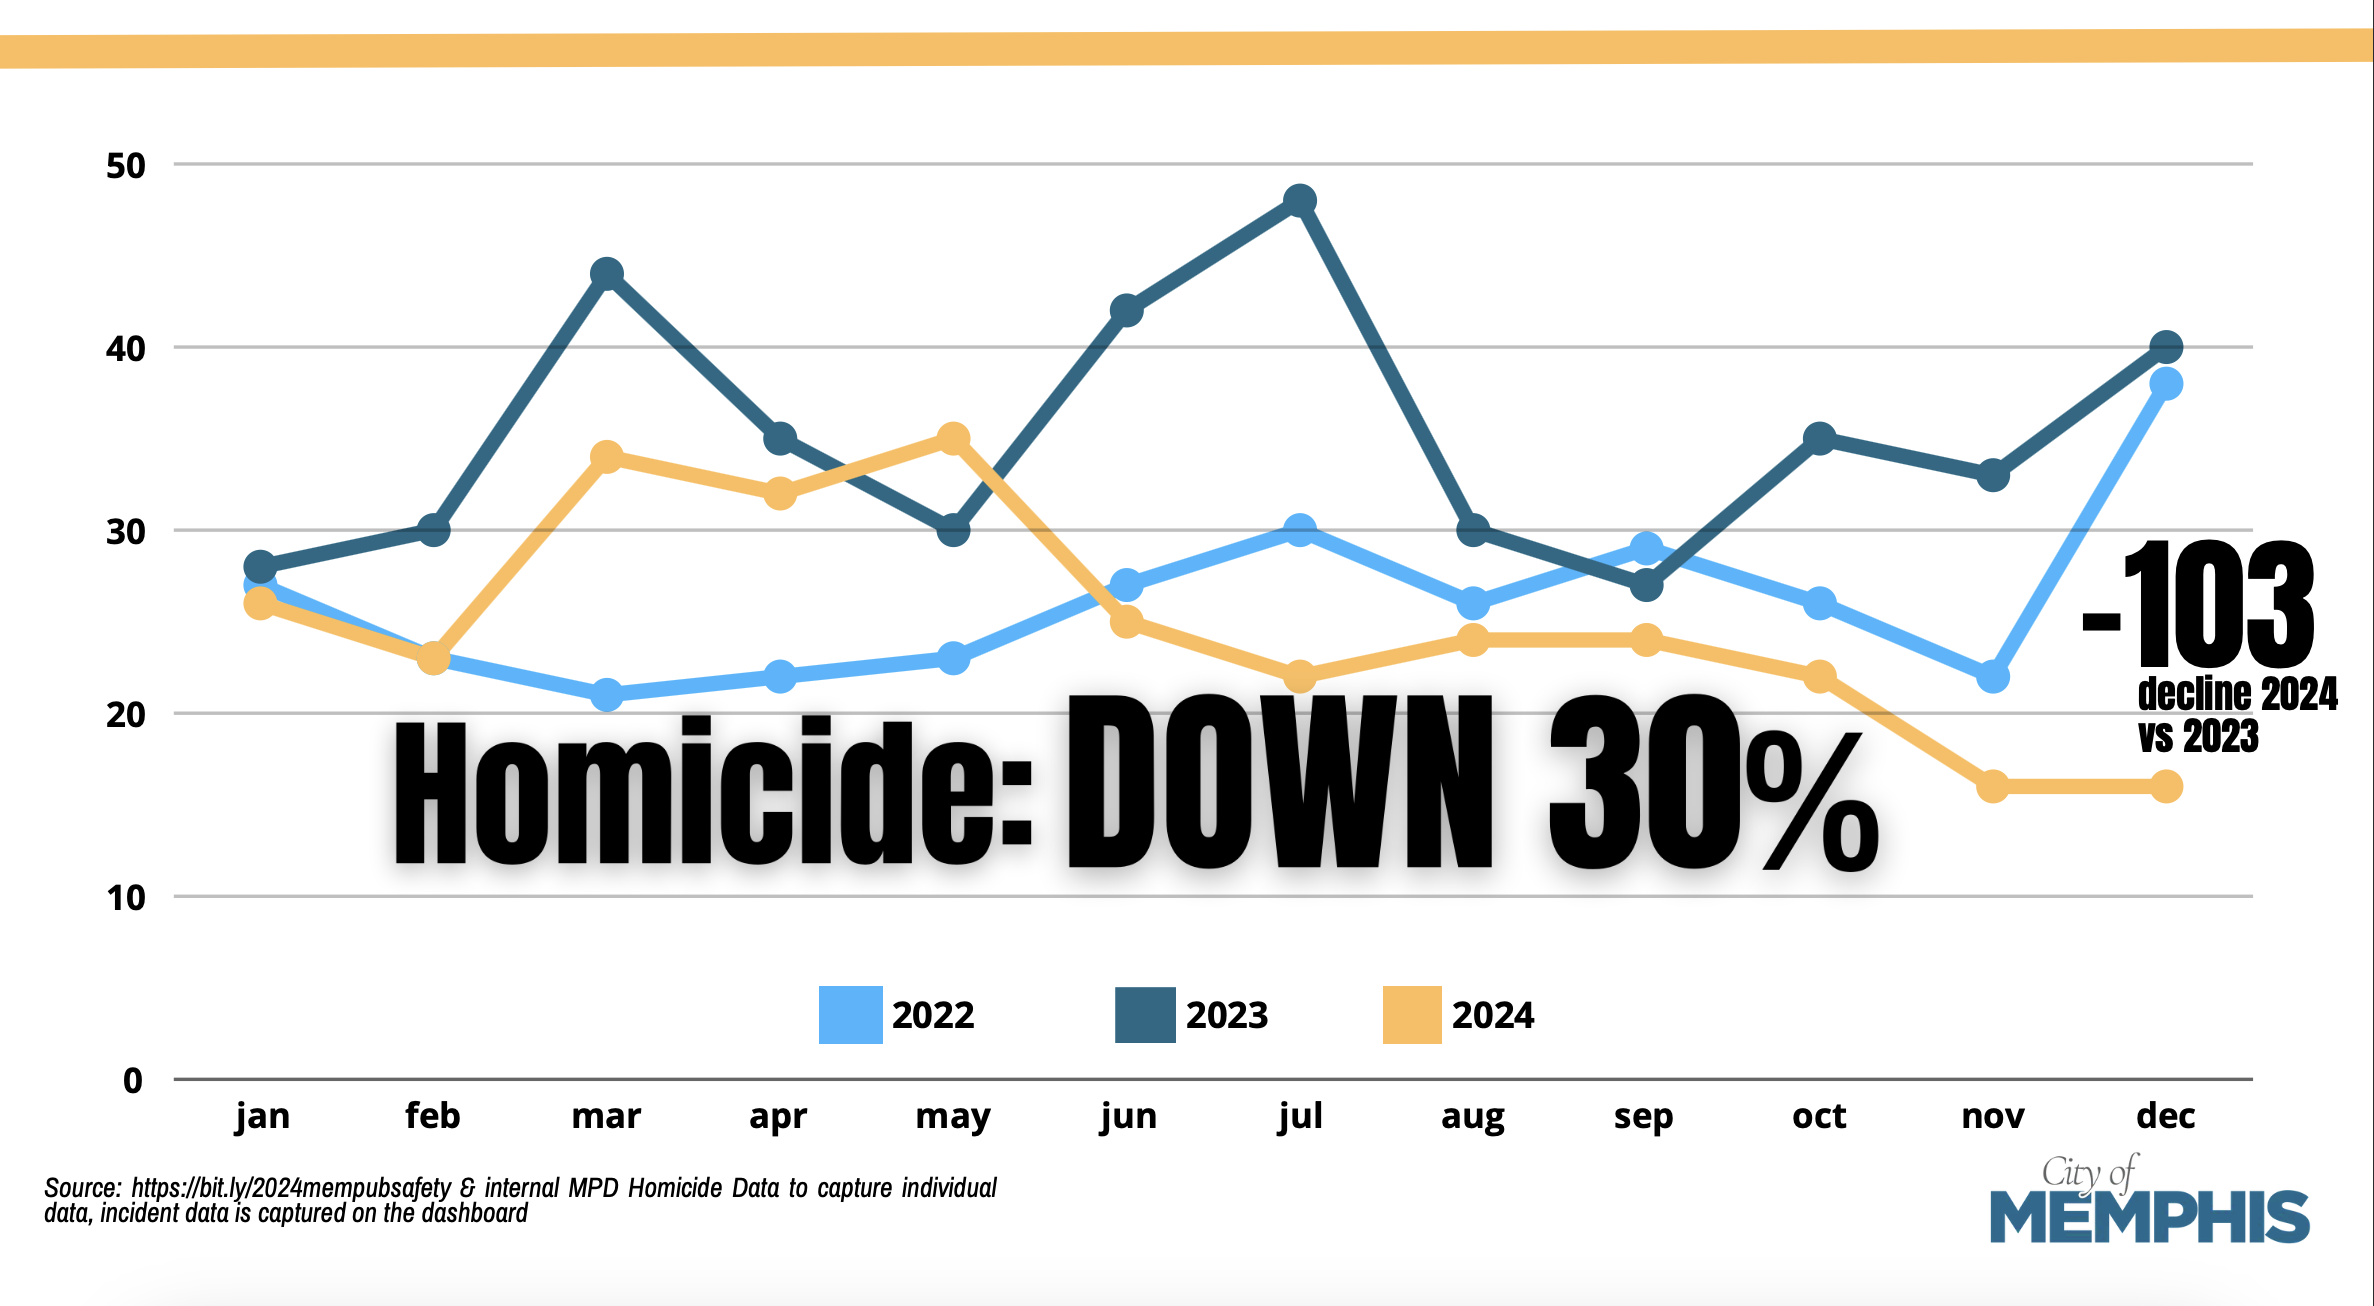
In total, there were 101,363 total crimes in Memphis last year. Of those, 10,642 were deemed violent crimes. There were 42,647 property crimes, 299 homicides (235 of those were murders), and 9,821 car thefts.
Pulling way back, though, the dashboard shows a map of concentrations of crime. We know you can likely overlay a map of poverty and other factors over the crime map and get commanding results. We’re not here to issue judgments about anything. But (and you knew that was coming) you can see, objectively, where the most crime happened in Memphis in 2024.
Top three ZIP codes for Memphis crime 2024:
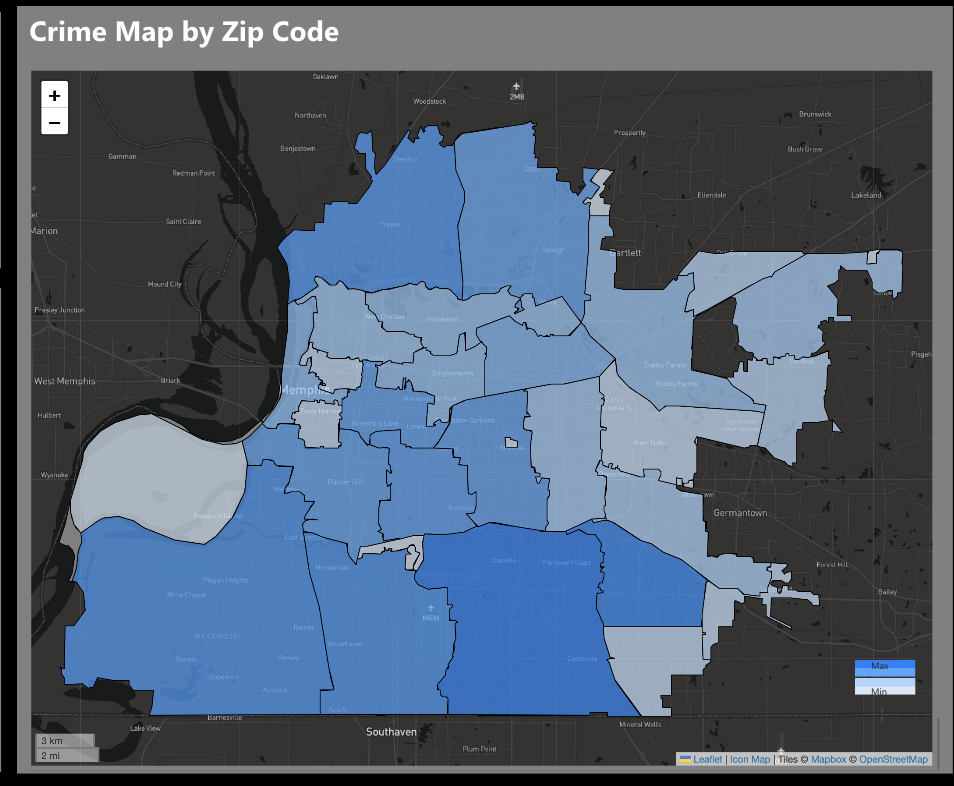
1. 38118 (Oakhaven, Parkway Village): 8,565 crimes
2. 38115 (Hickory Hill): 7,900 crimes
3. 38116 (Whitehaven) 6,841 crimes
Top three ZIP codes for Memphis homicides 2024:
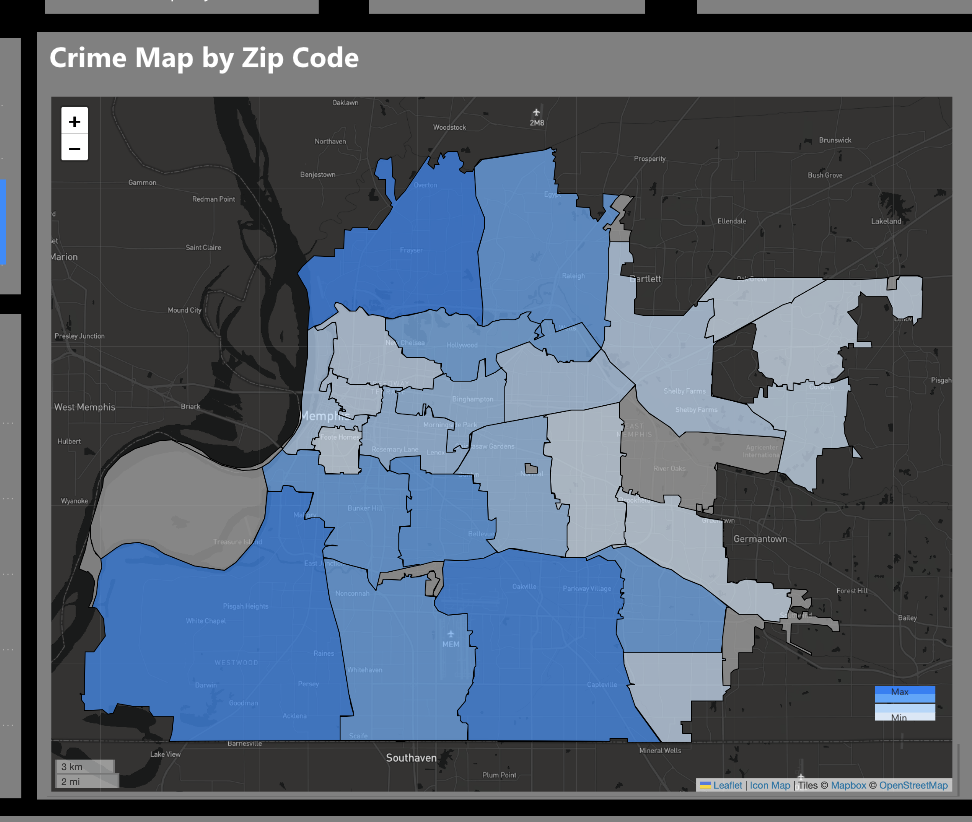
1. 38127 (Frayser): 33
2. 38109 (Raines): 31
3. 38118: (Parkway Village): 30
Top three ZIP codes for Memphis rapes 2024
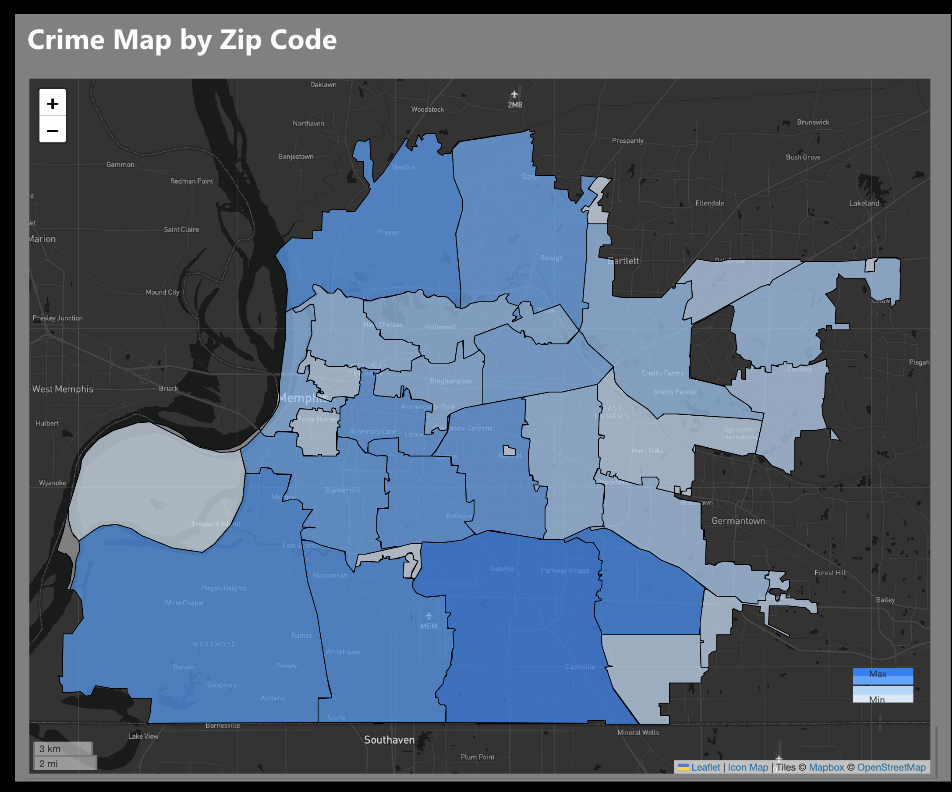
1. 38127 (Frayser): 56
2. 38116 (Whitehaven): 52
3. 38118 (Parkway Village): 50
Another dashboard, also maintained by the city of Memphis, shows weekly crime stats. This one does not give as much detail, like locations, nor does it break the crimes down much beyond the surface. But it still gives an interesting look at the state of the city.
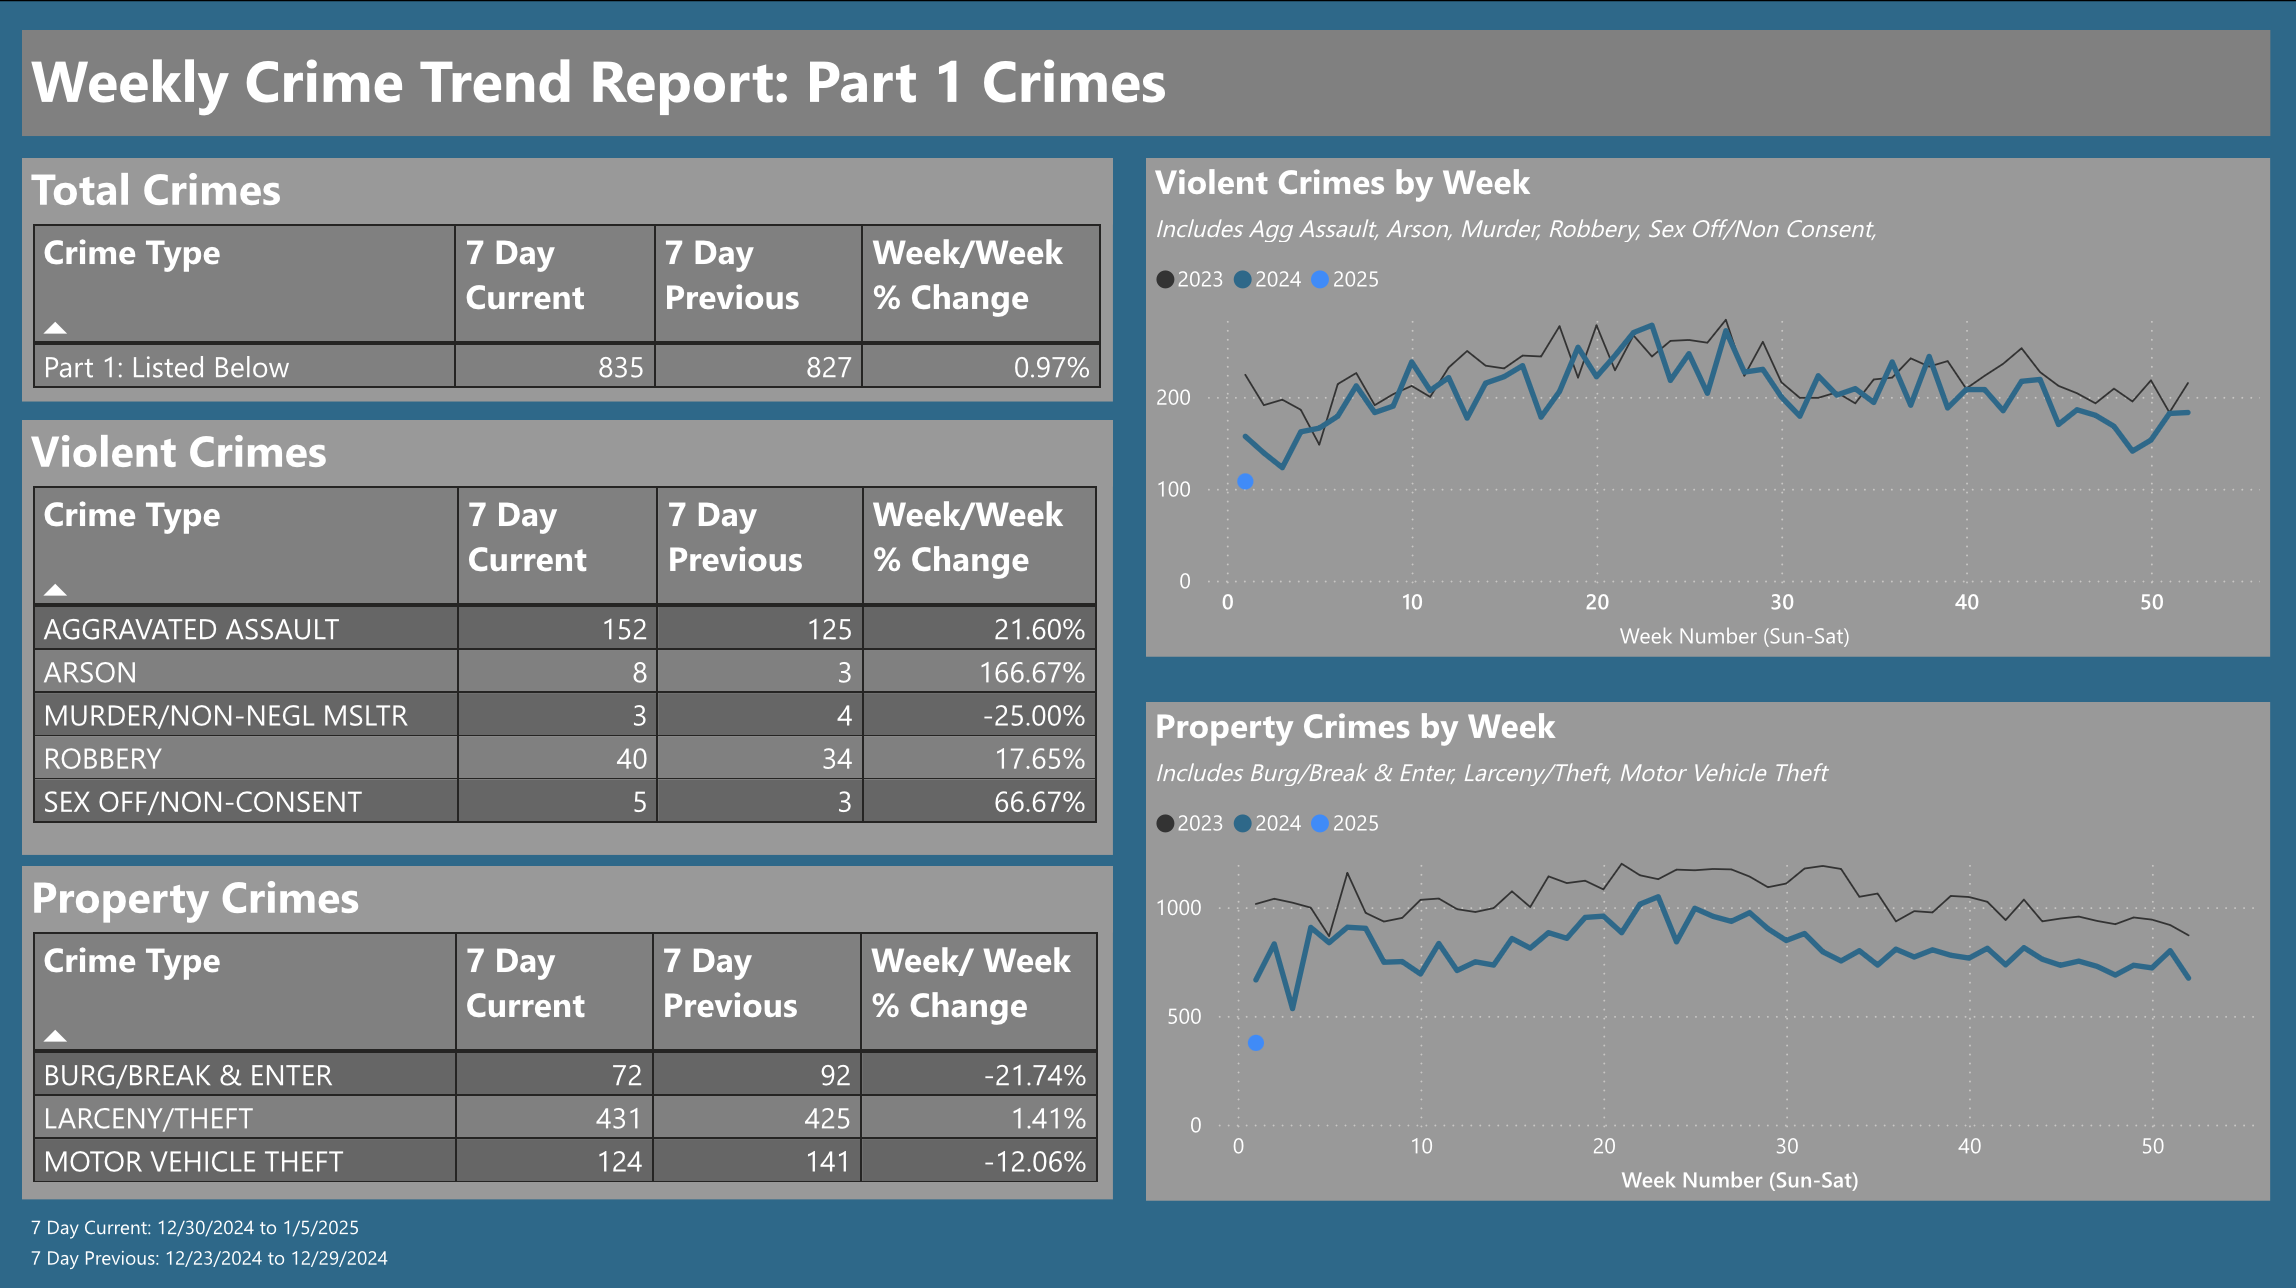
For example, over the last seven days (as of Monday, Jan. 6th), 835 crimes were committed. The seven days before that, 827 crimes were reported. Aggravated assaults (152) led all crimes as of Monday, with robbery (40), and rape (5) following.
On one metric — though — the dashboard somehow makes the city’s homicide count feel more real. It seems hard to fathom 299 homicides for a community in one year. It can also seem perfectly reasonable to have 299 homicides in a city the size of Memphis. But when the dashboard reports three homicides over the last seven days (and four homicides the week before that), the data seem more personal — these were people — and sad — these were someone’s family and friends.